Pokémon card market movers
A daily market-pulse index — which eras are heating up or cooling off, and today’s biggest price moves. As of September 3, 2026.
The vintage market is steady; modern cards are steady.
Breadth = the share of a group’s cards trading above their own 7-day average minus those below. Vintage = sets before 2011; modern = 2011–present.
Whole market · all tracked eras
steady+0.1% vs 7-day avg
1434 rising · 1043 falling · 9,537 cards
Vintage · pre-2011
steady+0.1% vs 7-day avg
791 rising · 697 falling · 4,154 cards
Modern · 2011–present
steady+0.1% vs 7-day avg
643 rising · 346 falling · 5,383 cards
| Era | Years | Cards | Trend | vs 7-day avg | Rising / falling |
|---|---|---|---|---|---|
| Mega Evolution | 2025–2026 | 341 | cooling off | -0.9% | 13 / 47 |
| Scarlet & Violet | 2023–2025 | 1,176 | softening | +0.0% | 76 / 40 |
| Sword & Shield | 2020–2023 | 1,285 | softening | +0.1% | 160 / 60 |
| Sun & Moon | 2017–2019 | 1,147 | firming | +0.2% | 122 / 54 |
| XY | 2013–2016 | 678 | softening | +0.0% | 148 / 65 |
| Black & White | 2011–2013 | 676 | firming | +0.4% | 97 / 74 |
| Call of Legends | 2011 | 80 | heating up | +0.7% | 27 / 6 |
| HeartGold & SoulSilver | 2010 | 268 | steady | -0.5% | 37 / 70 |
| Platinum | 2009 | 355 | heating up | +0.6% | 71 / 59 |
| Diamond & Pearl | 2007–2008 | 534 | heating up | +0.6% | 93 / 75 |
| EX | 2003–2007 | 1,386 | firming | +0.4% | 226 / 247 |
| E-Card | 2002–2003 | 528 | steady | +1.4% | 130 / 126 |
| Legendary Collection | 2002 | 96 | softening | -0.2% | 22 / 6 |
| Neo | 2000–2002 | 357 | softening | -0.3% | 74 / 35 |
| Gym | 2000 | 258 | cooling off | -2.1% | 22 / 45 |
| Base | 1999–2000 | 372 | cooling off | -1.5% | 116 / 34 |
Top gainers · day over day

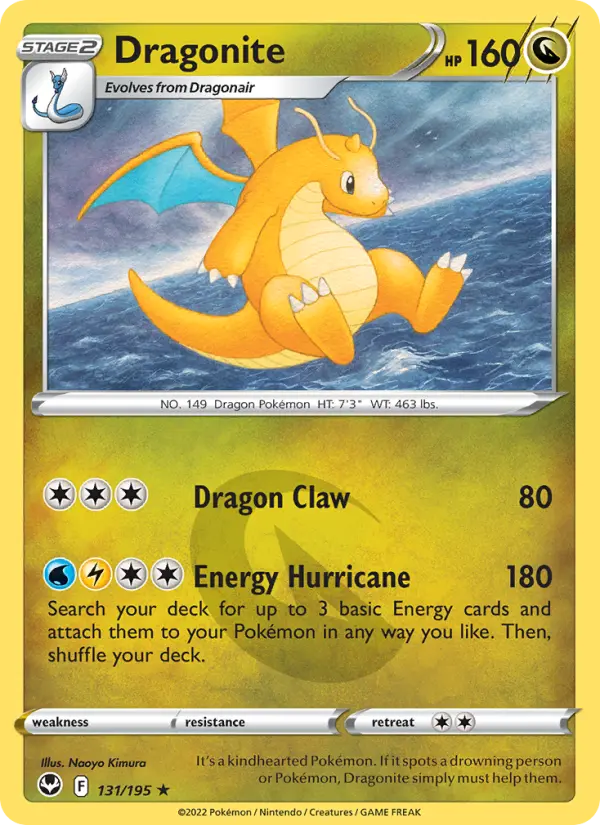
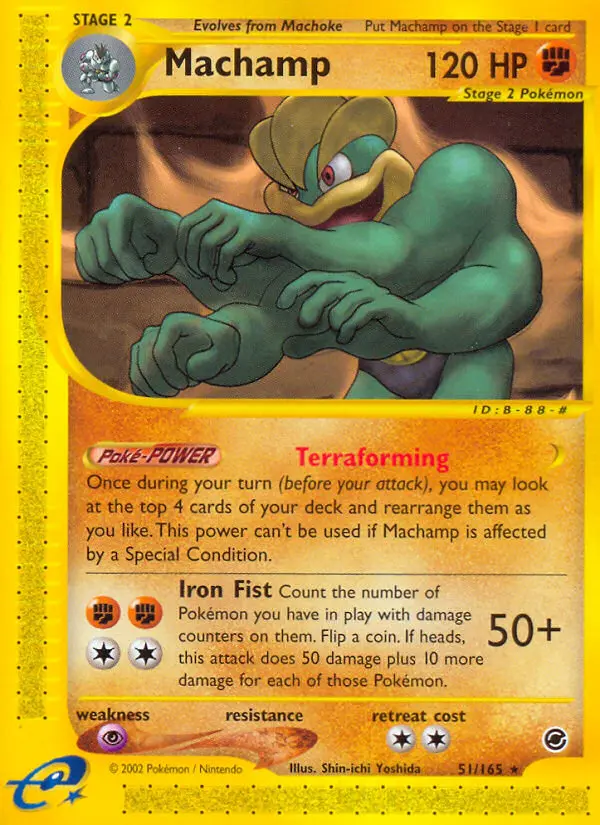
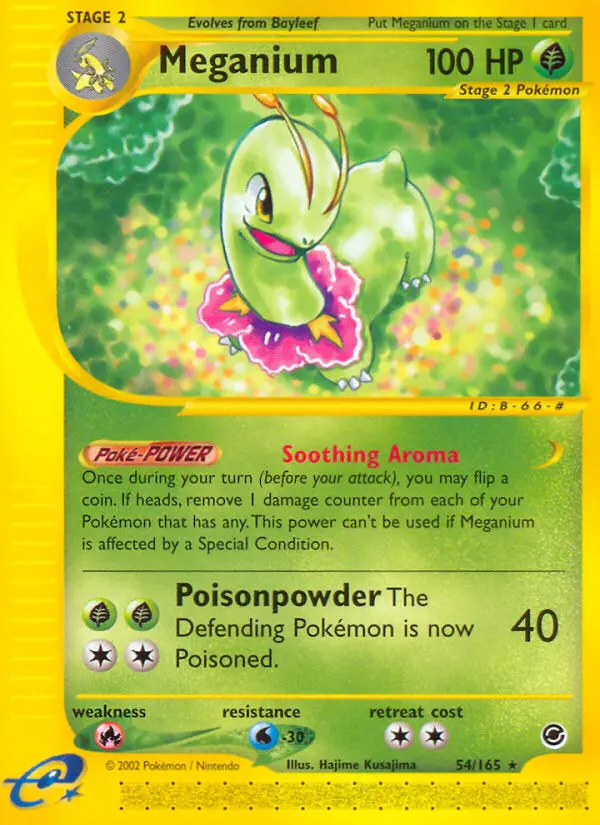
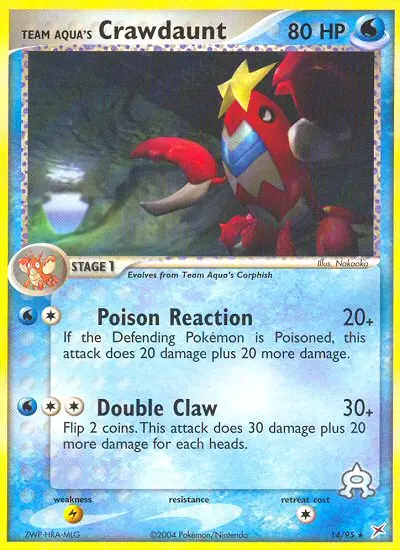
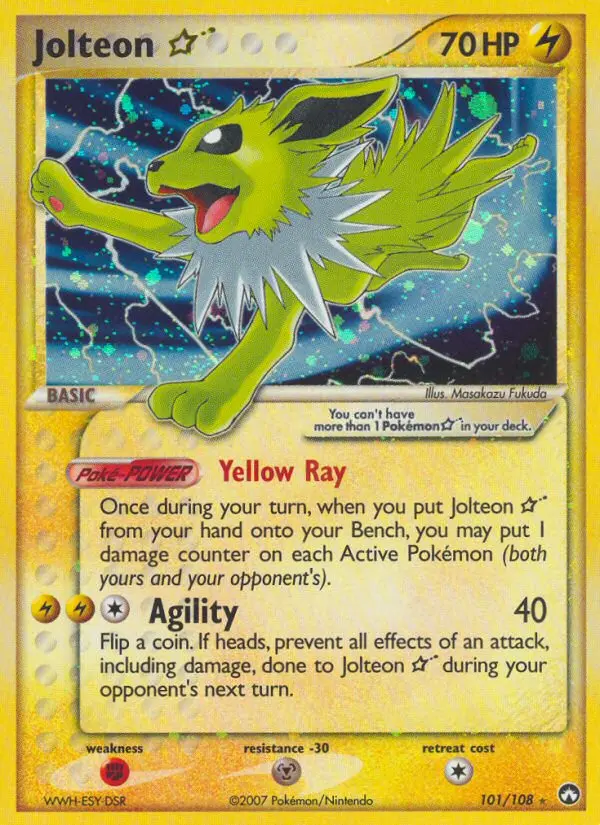
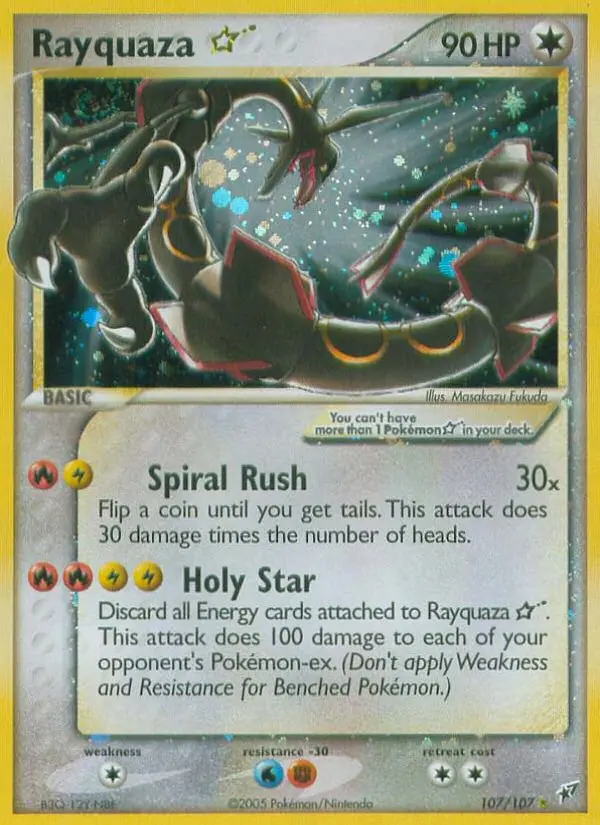

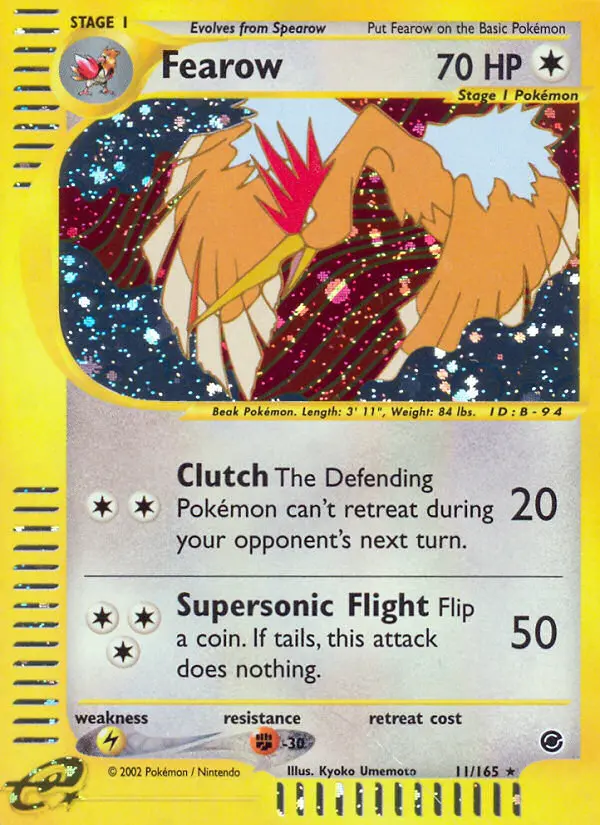
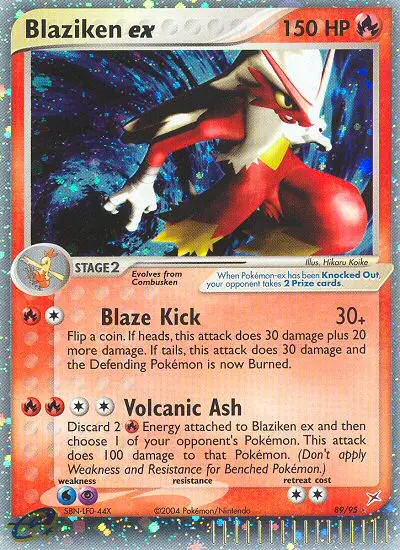
Moves are day-over-day changes in Riffle’s estimated market price, derived from live market data across 9,537 cards in 137 sets. Values shown are estimated ranges, not exact vendor prices. A “mover” is any card that changed at least 2% and trades above $1. Observational only — not investment advice. How these numbers work →